
Multiple Views
Display all thre axis:
- [a] Saggital view (along y-axis, Side view)
- [b] Axial (Tranverse) view (along z-axis, Top view)
- [c] Coronal view (along x-axis, Back view)

import scipy.io as sio
import plotly.graph_objs as go
from ipywidgets import interactive, HBox, widgets, interact
import numpy as np
from plotly.offline import download_plotlyjs, init_notebook_mode, plot, iplot
from IPython.core.display import display, HTML
import os
init_notebook_mode(connected=True)
config={'showLink': False, 'displayModeBar': False}
# If you run on your local machine comment out this line
os.chdir("/home/jovyan/content/04/subsection/03")
# Load matrix callculated in the previous section
matrix = sio.loadmat(file_name = "newmap.mat", matlab_compatible = True)
newmap = matrix['vect']
# Rotate to get picutre
matrix = np.rot90(newmap)
# Get # of slices
slices_y = newmap.shape[2]
# Create list of Heatmaps, one for every slice
data = []
for i in range(slices_y):
z_current = np.rot90(matrix[:,:,i], 2)
data_c = go.Heatmap(z = z_current,
visible = False,
xtype = "scaled",
ytype = "scaled",
colorscale = "viridis",
colorbar = dict(title = dict(text = "FA [°]")))
data.append(data_c)
# Toggle frist slice to be visible
data[0]['visible'] = True
# Create steps and slider
steps = []
for i in range(slices_y):
step = dict(
method = 'restyle',
args = ['visible', [False]*slices_y],
label = str(i)
)
step['args'][1][i] = True # Toggle i'th trace to "visible"
steps.append(step)
sliders = [dict(
active = 0,
currentvalue = {'prefix':"Current slice is: <b>"},
pad = {"t": 50, "b": 10},
steps = steps
)]
# Setup the layout of the figure
layout = go.Layout(
width=458,
height=550,
margin=go.layout.Margin(
l=50,
r=50,
b=60,
t=15,
),
showlegend = False,
autosize = False,
sliders=sliders,
xaxis = dict(showgrid = False,
showticklabels= False),
yaxis = dict(showgrid = False,
showticklabels = False),
)
# Plot function saves as html
fig = dict(data=data, layout=layout)
plot(fig, filename = 'a_saggital.html', config = config)
# iplot(fig,config=config) # BINDER
display(HTML('a_saggital.html')) # THEBELAB
Total of 32 slices [y-axis]
import scipy.io as sio
import plotly.graph_objs as go
from ipywidgets import interactive, HBox, widgets, interact
import numpy as np
from plotly.offline import download_plotlyjs, init_notebook_mode, plot, iplot
from IPython.core.display import display, HTML
import os
init_notebook_mode(connected=True)
config={'showLink': False, 'displayModeBar': False}
# If you run on your local machine comment out this line
os.chdir("/home/jovyan/content/04/subsection/03")
# Load matrix callculated in the previous section
matrix = sio.loadmat(file_name = "newmap.mat", matlab_compatible = True)
newmap = matrix['vect']
# Rotate to get picutre
matrix = np.rot90(newmap)
# Get # of slices
slices_z = newmap.shape[0]
# Create list of Heatmaps, one for every slice
data = []
for i in range(slices_z):
z_current = np.rot90(matrix[i,:,:], 2)
data_c = go.Heatmap(z = z_current,
visible = False,
xtype = "scaled",
ytype = "scaled",
colorscale = "viridis",
colorbar = dict(title = dict(text = "FA [°]")))
data.append(data_c)
# Toggle frist slice to be visible
data[0]['visible'] = True
# Create steps and slider
steps = []
for i in range(slices_z):
step = dict(
method = 'restyle',
args = ['visible', [False]*slices_z],
label = str(i)
)
step['args'][1][i] = True # Toggle i'th trace to "visible"
steps.append(step)
sliders = [dict(
active = 0,
currentvalue = {'prefix':"Current slice is: <b>"},
pad = {"t": 50, "b": 10},
steps = steps
)]
# Setup the layout of the figure
layout = go.Layout(
width=458,
height=550,
margin=go.layout.Margin(
l=50,
r=50,
b=60,
t=15,
),
showlegend = False,
autosize = False,
sliders=sliders,
xaxis = dict(showgrid = False,
showticklabels= False),
yaxis = dict(showgrid = False,
showticklabels = False),
)
# Plot function saves as html
fig = dict(data=data, layout=layout)
plot(fig, filename = 'b_axial.html', config = config)
# iplot(fig,config=config) # BINDER
display(HTML('b_axial.html')) # THEBELAB
Total of 42 slices [z-axis]
import scipy.io as sio
import plotly.graph_objs as go
from ipywidgets import interactive, HBox, widgets, interact
import numpy as np
from plotly.offline import download_plotlyjs, init_notebook_mode, plot, iplot
from IPython.core.display import display, HTML
import os
init_notebook_mode(connected=True)
config={'showLink': False, 'displayModeBar': False}
# If you run on your local machine comment out this line
os.chdir("/home/jovyan/content/04/subsection/03")
# Load matrix callculated in the previous section
matrix = sio.loadmat(file_name = "newmap.mat", matlab_compatible = True)
newmap = matrix['vect']
# Rotate to get picutre
matrix = np.rot90(newmap)
# Get # of slices
slices_x = newmap.shape[1]
# Create list of Heatmaps, one for every slice
data = []
for i in range(slices_x):
z_current = np.rot90(matrix[:,i,:], 2)
data_c = go.Heatmap(z = z_current,
visible = False,
xtype = "scaled",
ytype = "scaled",
colorscale = "viridis",
colorbar = dict(title = dict(text = "FA [°]")))
data.append(data_c)
# Toggle frist slice to be visible
data[0]['visible'] = True
# Create steps and slider
steps = []
for i in range(slices_x):
step = dict(
method = 'restyle',
args = ['visible', [False]*slices_x],
label = str(i)
)
step['args'][1][i] = True # Toggle i'th trace to "visible"
steps.append(step)
sliders = [dict(
active = 0,
currentvalue = {'prefix':"Current slice is: <b>"},
pad = {"t": 50, "b": 10},
steps = steps
)]
# Setup the layout of the figure
layout = go.Layout(
width=458,
height=550,
margin=go.layout.Margin(
l=50,
r=50,
b=60,
t=15,
),
showlegend = False,
autosize = False,
sliders=sliders,
xaxis = dict(showgrid = False,
showticklabels= False),
yaxis = dict(showgrid = False,
showticklabels = False),
)
# Plot function saves as html
fig = dict(data=data, layout=layout)
plot(fig, filename = 'c_coronal.html', config = config)
# iplot(fig,config=config) # BINDER
display(HTML('c_coronal.html')) # THEBELAB
Total of 42 slices [x-axis]
Note: iPywidgets multiple plane view figure does not appear when you click "Show Widgets", brief preview 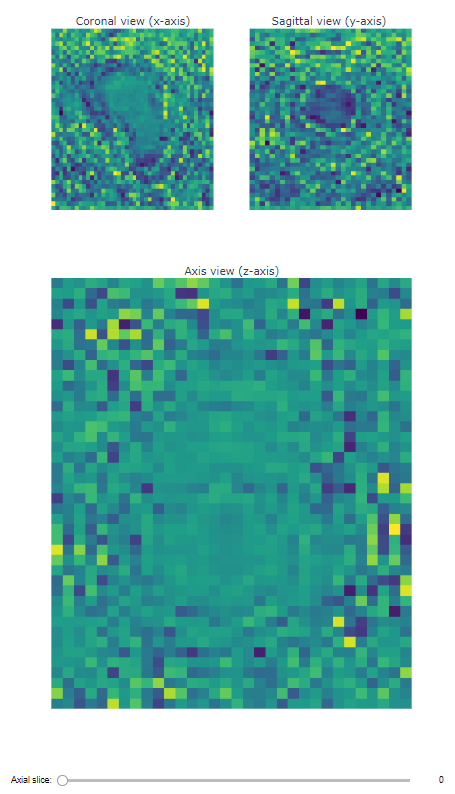

import scipy.io as sio
import plotly.graph_objs as go
from ipywidgets import interactive, HBox, widgets, interact
import numpy as np
from plotly.offline import download_plotlyjs, init_notebook_mode, plot, iplot
from IPython.core.display import display, HTML
import os
from ipywidgets import widgets
from plotly.subplots import make_subplots
import json
from ipywidgets.embed import embed_data
import os
init_notebook_mode(connected=True)
config={'showLink': False, 'displayModeBar': False}
# Change path (Uncomment if loccaly)
os.chdir("/home/jovyan/content/04/subsection/03")
matrix = sio.loadmat(file_name = "newmap.mat", matlab_compatible = True)
newmap = matrix['vect']
slices_x = newmap.shape[1]
slices_y = newmap.shape[2]
slices_z = newmap.shape[0]
meta0 = []
for i in range(0,41):
for j in range(0,31):
data = [i,j]
meta0.append(data)
# Rotate to get picutre
matrix = np.rot90(newmap)
# Create zero matricies
zero_matrix1 = np.rot90(matrix[:,:,0], 2) # Y oska [SIDE]
zero_matrix2 = np.rot90(matrix[:,0,:], 2) # X oska [BACK]
zero_matrix3 = np.rot90(matrix[0,:,:], 2) # Z oska [TOP]
fig = make_subplots(rows=3,
cols=2,
vertical_spacing = 0.1,
specs=[[{}, {}],
[{"rowspan":2, "colspan": 2}, None],
[None, None]],
insets=[{'cell': (1,1), 'l': 0.7, 'b': 0.3}],
subplot_titles=("Coronal view (x-axis)",
"Sagittal view (y-axis) ",
"Axis view (z-axis)"))
# Y axis - Saggital view (32 slices)
trace1 = fig.add_trace(go.Heatmap(z = zero_matrix1,
showscale = False,
hoverinfo = 'x+y',
colorscale='viridis'),1,1)
# X axis - Coronal view (42 slices)
trace2 = fig.add_trace(go.Heatmap(z = zero_matrix2,
showscale = False,
hoverinfo = 'x+y',
colorscale='viridis'),1,2)
# Z axis - Axis view (42 slices)
trace3 = fig.add_trace(go.Heatmap(z = zero_matrix3,
showscale = False,
hoverinfo = 'x+y',
colorscale='viridis',
customdata = meta0),2,1)
# Setup layout
fig.update_traces(overwrite=True)
fig.update_xaxes(visible=False)
fig.update_yaxes(visible=False)
fig.update_layout(height=1200, width=700)
# Create FigureWidget from fig.
f = go.FigureWidget(data=fig.data, layout=fig.layout)
f.layout.title = 'Axis view'
f.layout.title.xanchor = 'center'
f.layout.title.x = 0.5
# Create IntSlider
slider = widgets.IntSlider(
value=0,
min=0,
max=slices_z-1,
step=1,
description='Axial slice:',
disabled=False,
continuous_update=True,
orientation='horizontal',
readout=True,
readout_format='d'
)
slider.layout.height = '50px'
slider.layout.width = '700px'
# Function that will modify plot.
def update(y):
f.data[2]['z'] = np.rot90(matrix[y,:,:], 2)
# create our callback function
def update_point(trace, points, selector):
print(points.point_inds[0])
ind = points.point_inds[0]
x = ind[1] #-> x
y = ind[0] #-> y
f.data[0]['z'] = np.rot90(matrix[:,y,:], 2)
f.data[1]['z'] = np.rot90(matrix[:,:,x], 2)
f.data[2].on_click(update_point, True) # z axis
# Display the FigureWidget and slider with center justification.
vb = widgets.VBox((f, interactive(update, y=slider)))
vb.layout.align_items = 'center'
display(vb)