
Plotly
![]()
This last section is for some of the figures and data from the paper, made interactive using Plotly. Plotly is a technical computing company headquartered in Montreal, Quebec, that develops online data analytics and visualization tools. Plotly was founded by Alex Johnson, Jack Parmer, Chris Parmer, and Matthew Sundquist.
Plotly provides online graphing, analytics, and statistics tools for individuals and collaboration, as well as scientific graphing libraries for Python, R, MATLAB, Perl, Julia, Arduino, and REST.
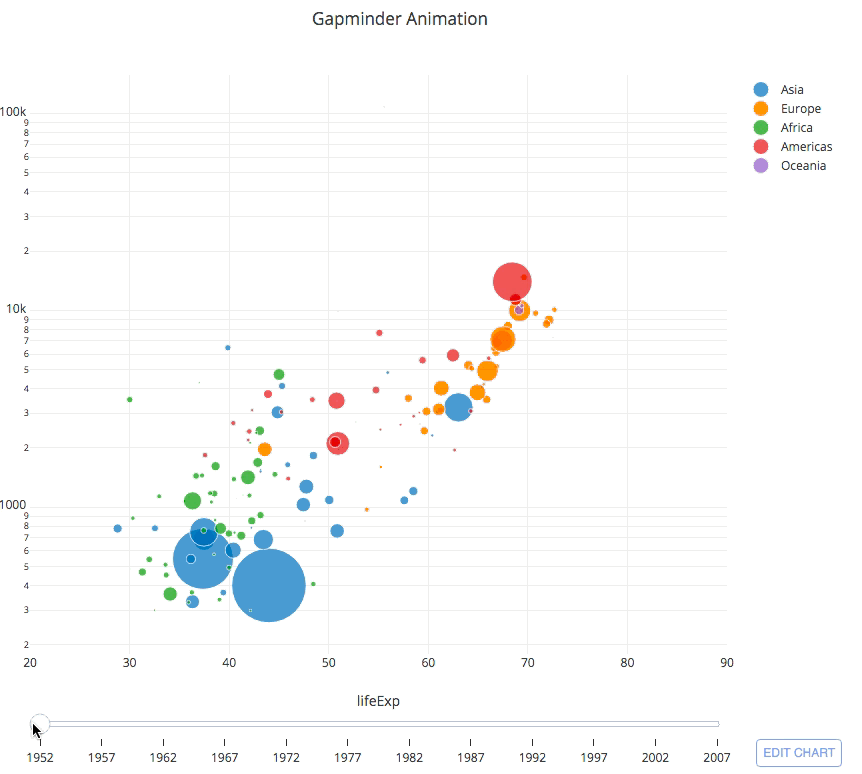
Example of an intresting animation is this figure for life expectancy build using Python and Plotly:
Source: https://plotly.com/chart-studio-help/create-animations/